Benching & Profiling
“We should forget about small efficiencies, say about 97% of the time: premature optimization is the root of all evil”
– D. Knuth
Profiling
The base application provides a Profiler that knows how to generate profiling data that you’ll be able to visualize in KCacheGrind.
To enable it you can toggle the profile flag to True in your paster file. See Configuring the Profiler.
Restart your application using the built-in Paster server and start to use it or run a load test on it.
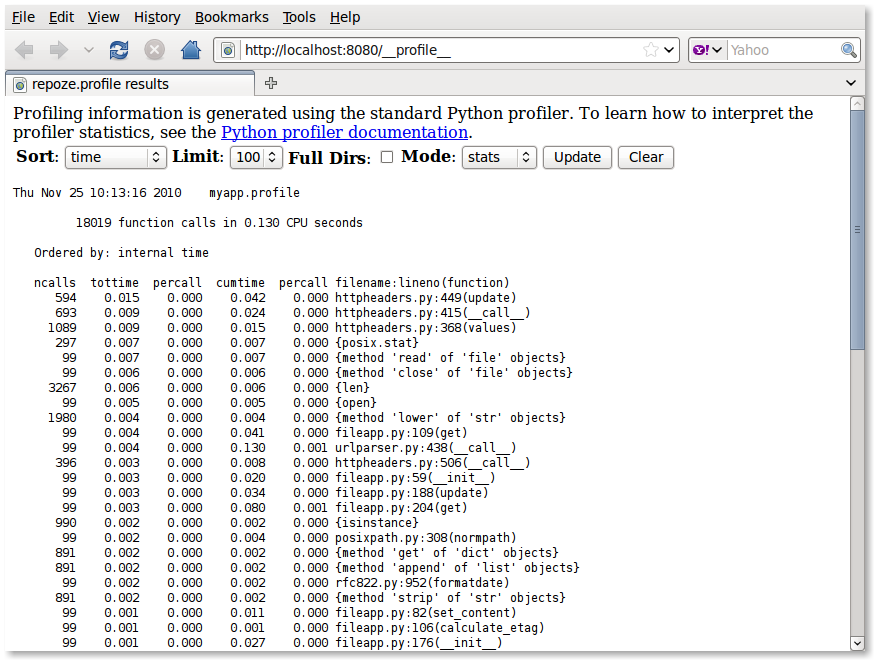
Remember that once enabled, your application will be really slow because the profiling is done by wrapping all calls in the Python interpreter.
You can display the profile information in real-time by visiting http://localhost:5000/__profile__
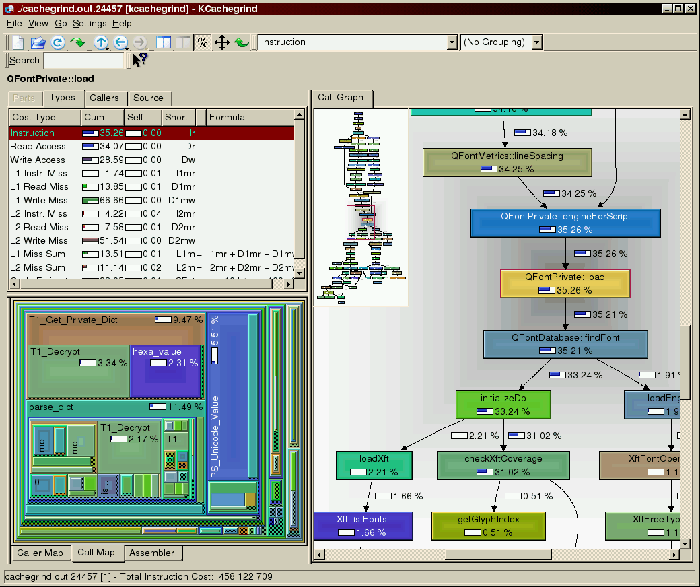
But the real work should be done in KCacheGrind. Once you have finished testing the application, stop it and you should find at the root of your application a cachegrind.out file you can open.
Benching
XXX